Step 1 of 7Reports
The Reports hub
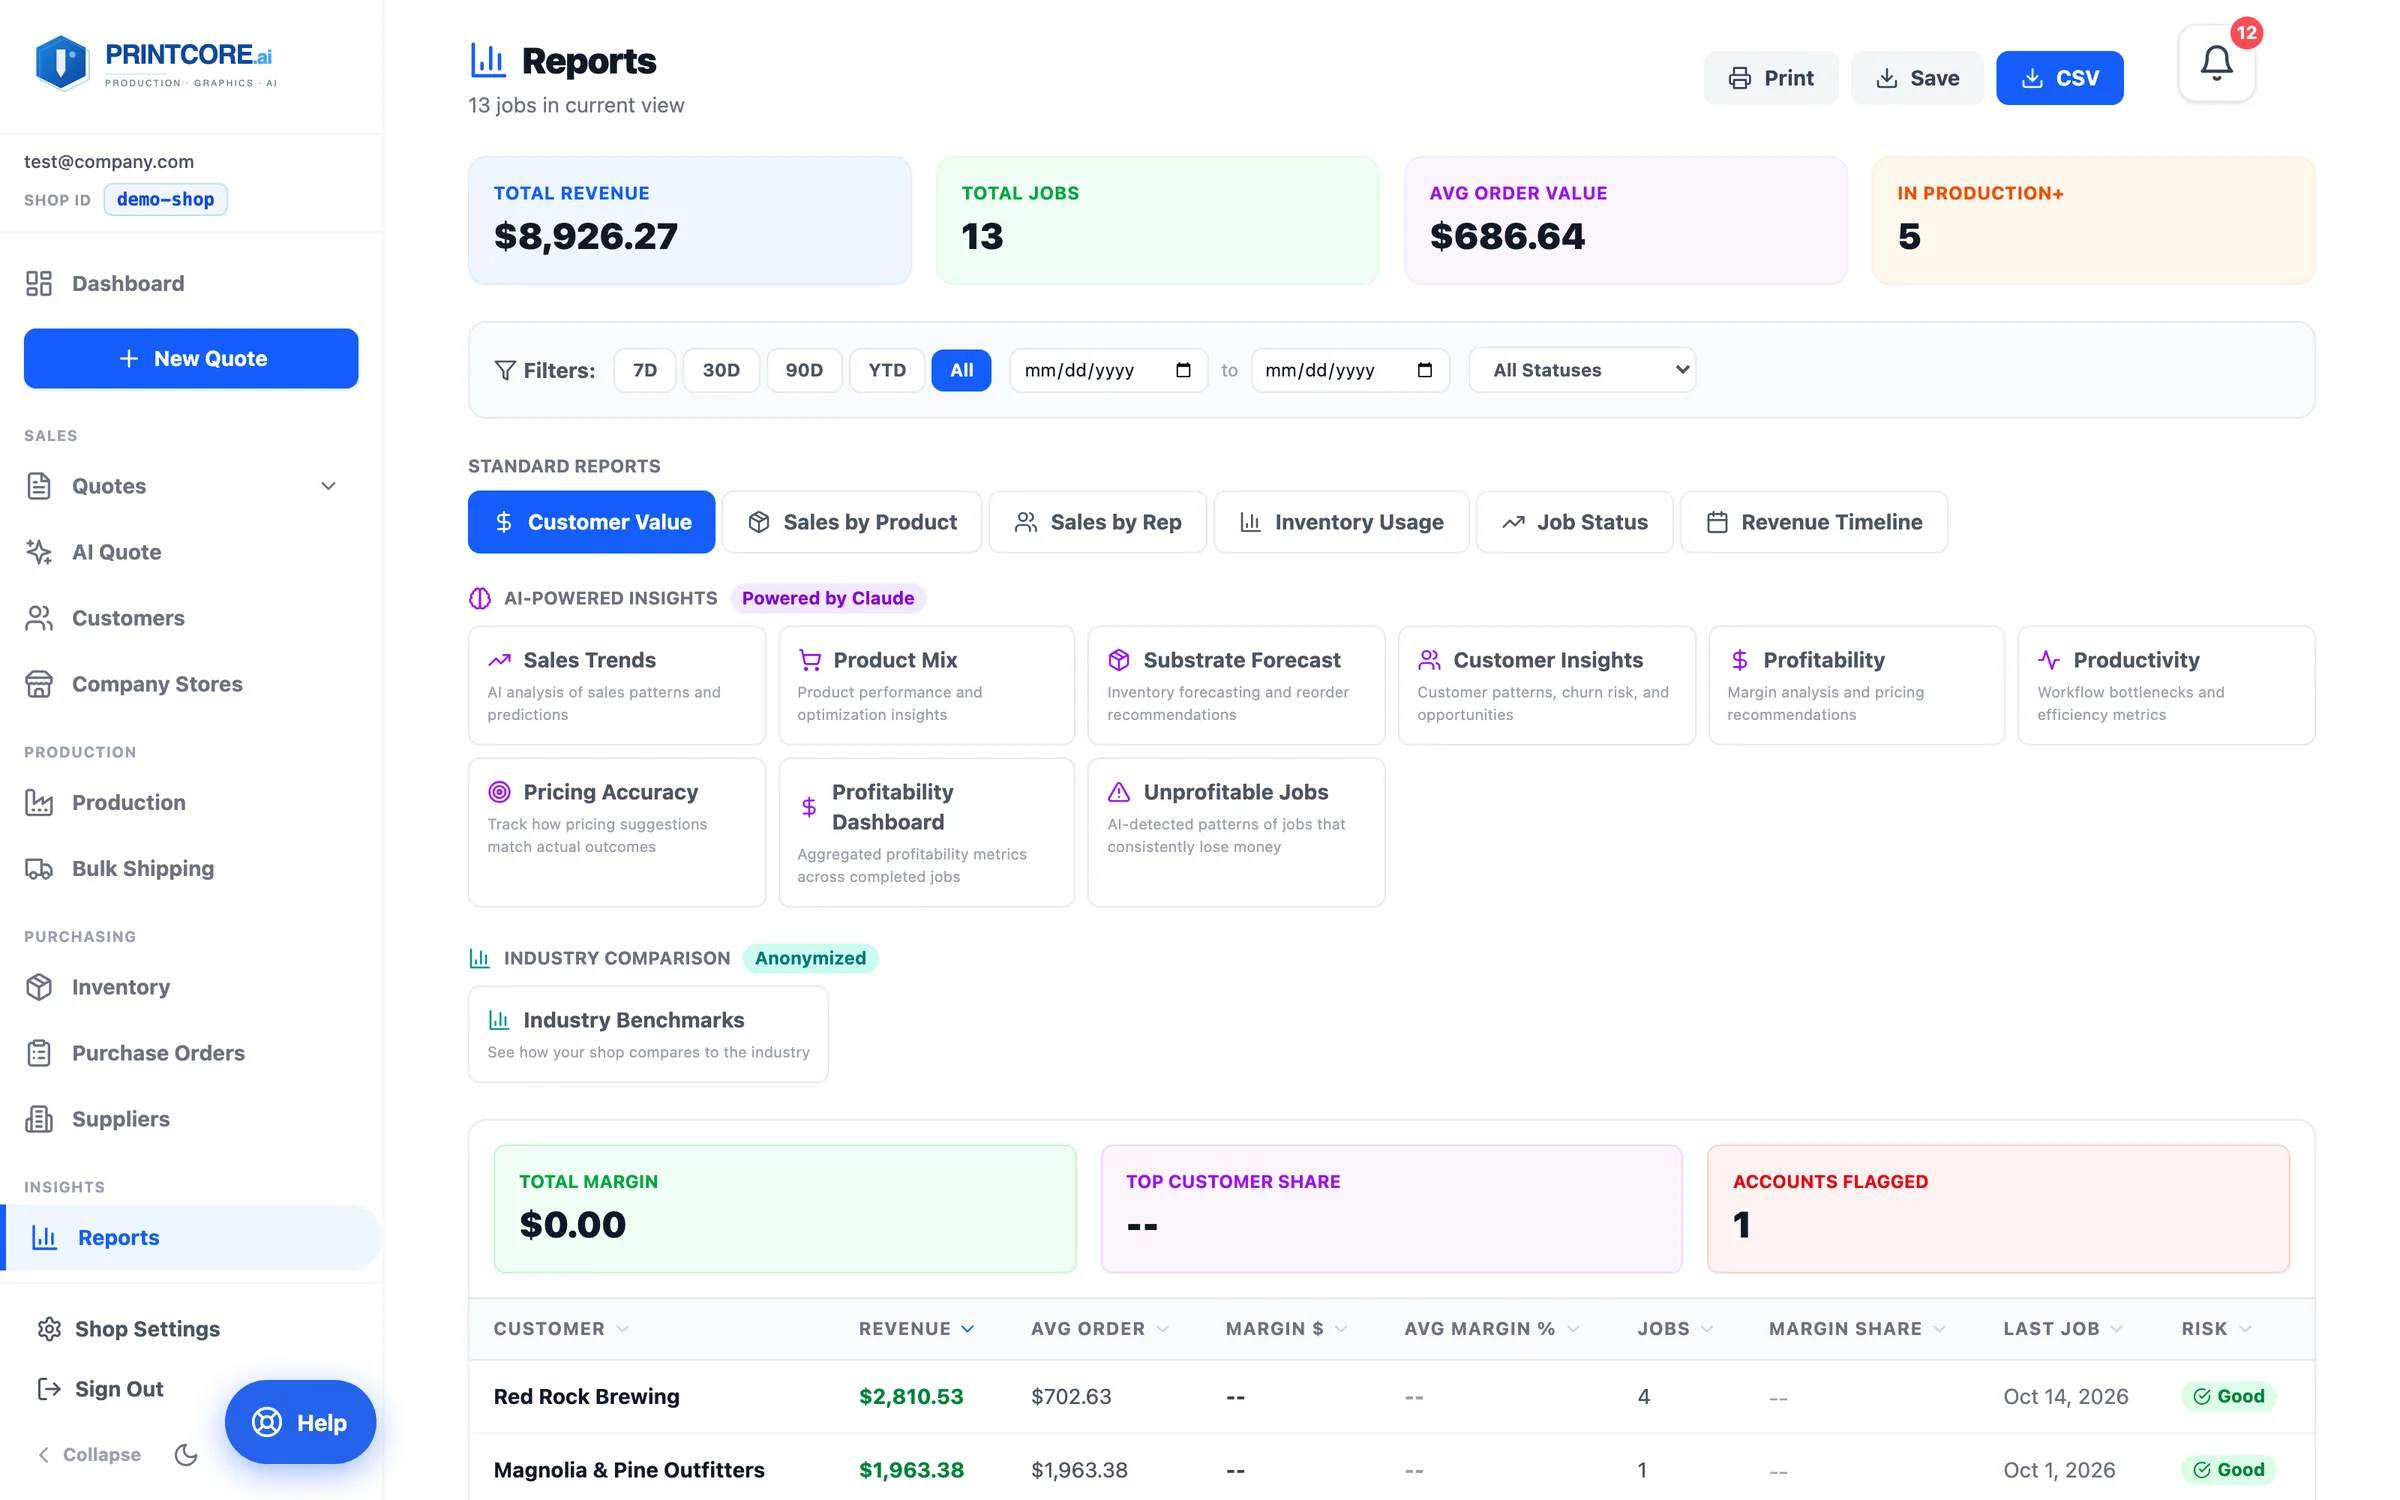
At the top: KPIs for revenue, jobs, average order value, and what's in production. Below: standard reports and AI-powered insights — all built on your live data. Archived jobs keep the stage they reached, so completed revenue is counted correctly.
What to do
Click Reports in the side menu. Scan the KPI strip up top, then explore the report tabs.
Why it matters
Most shops never have time to build reports. Printcore precomputes the headline numbers so you can spot-check the health of the business in 30 seconds.
Step 2 of 7Reports
Standard reports
Customer Value, Sales by Product, Sales by Rep (with commission), Inventory Usage, Job Status, Revenue Timeline.
What to do
Click any standard tab to switch the report view. Use the filter chips above (7D, 30D, 90D, 6M, YTD, All) to scope the date range.
Why it matters
These are the day-to-day numbers every shop owner needs. Pulling them out of Printcore takes a click instead of an afternoon in spreadsheets.
Step 3 of 7Reports
AI-powered insights
Reports powered by Claude: Sales Trends, Product Mix, Substrate Forecast, Customer Insights, Profitability, Productivity — plus the Pricing Accuracy, Profitability Dashboard, and Unprofitable Jobs dashboards and an opt-in Industry Benchmarks comparison.
What to do
Click any tile in the AI-Powered Insights grid. Each opens with the highlights at the top and the underlying analysis below.
Why it matters
This is the layer that sets Printcore apart from a pure ERP. The AI surfaces patterns, risks, and forecasts your team would otherwise miss.
Step 4 of 7Reports
Profitability
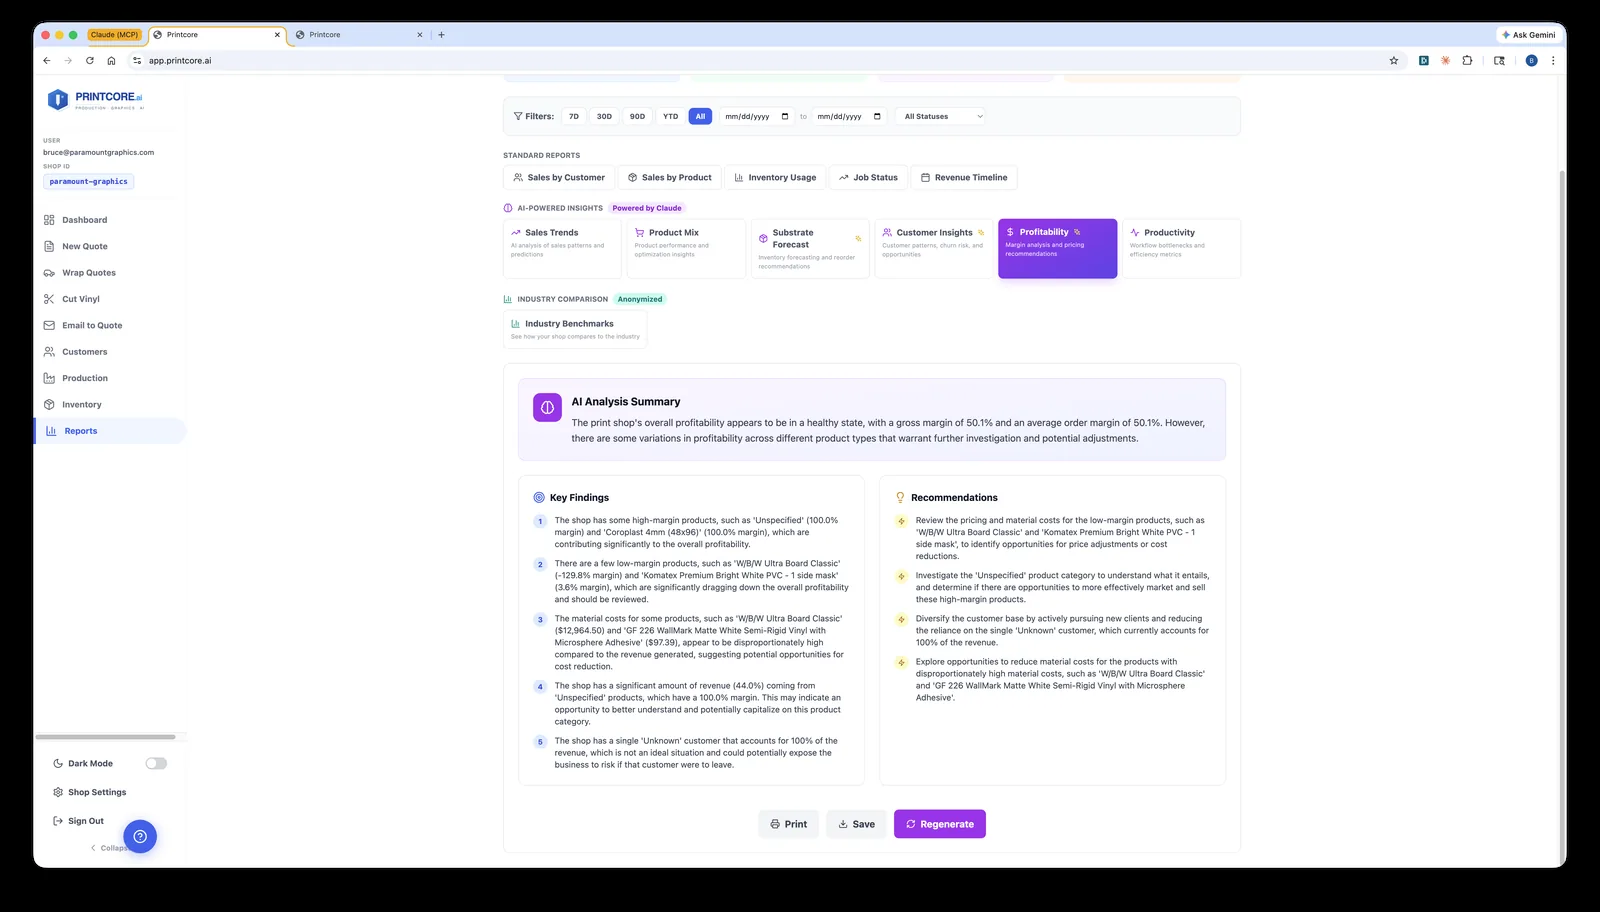
The AI Profitability report reads your margins by product and customer and tells you where money is leaking. The Profitability Dashboard and Unprofitable Jobs tiles go job by job, and margin alerts also show up in your notification bell.
What to do
Pick the Profitability tile for the AI summary and recommendations, or Unprofitable Jobs for the list of jobs that lost money.
Why it matters
You stop guessing what's making money. The unprofitable jobs become impossible to ignore.
Step 5 of 7Reports
Customer Value & Insights
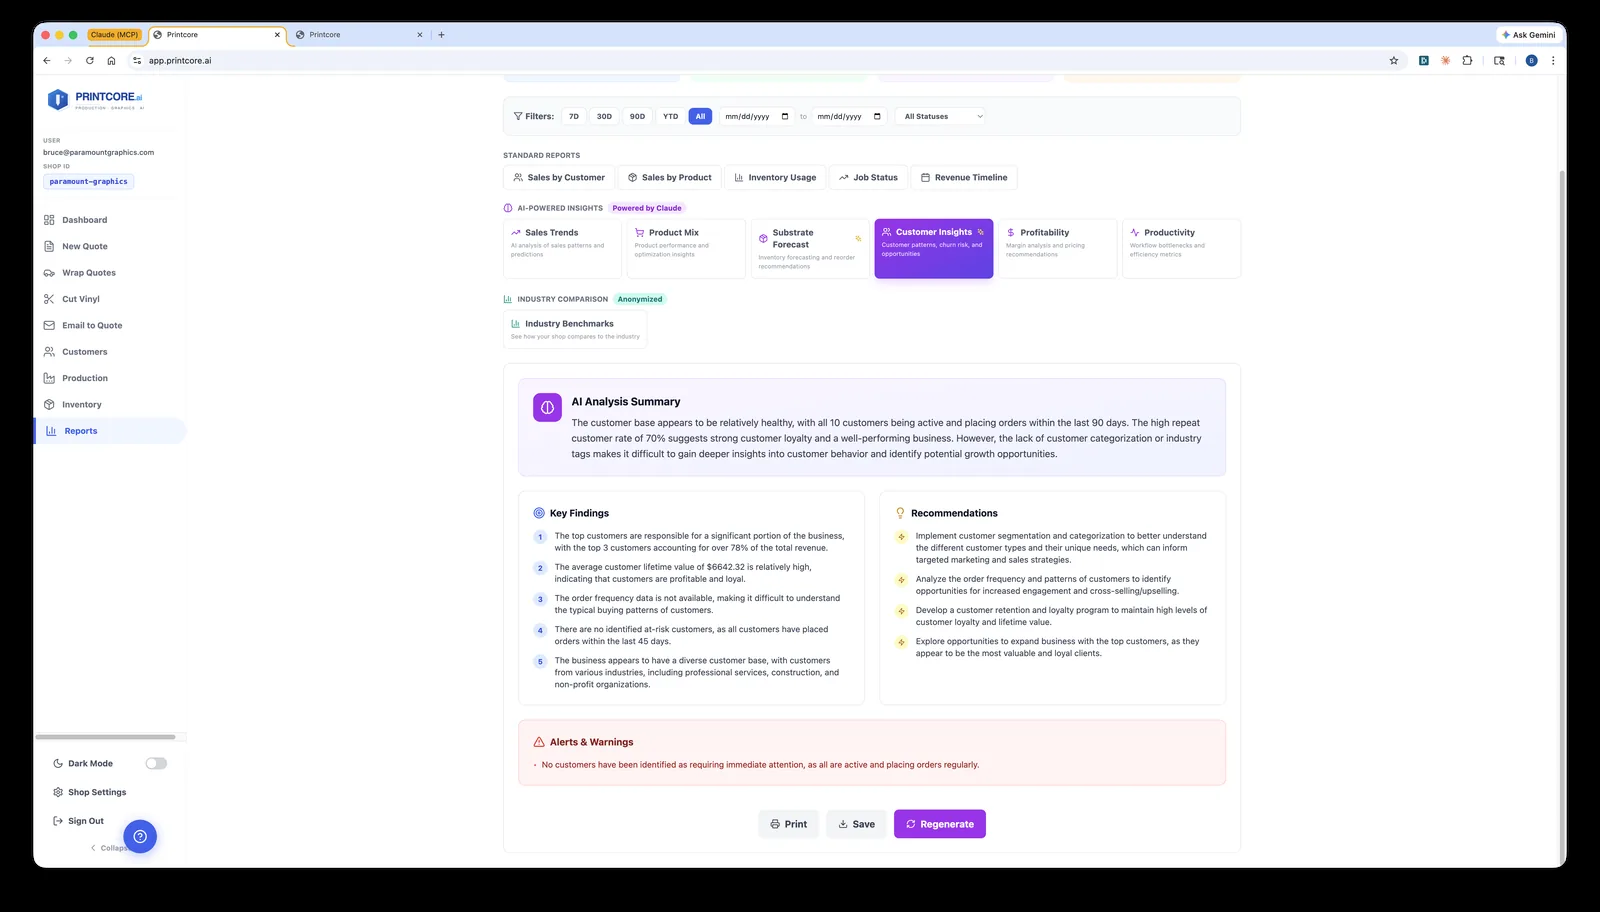
Rank accounts by margin contribution, flag slow payers, and see at-risk and gone-quiet accounts with forecasted next orders.
What to do
Open Customer Value or the AI Customer Insights report. The Customer Value table rates each account (Good / Watch) and the Accounts Flagged total shows who needs attention.
Why it matters
Winning back a lapsed customer is 5× easier than finding a new one. This report tells you exactly who needs a call this week.
Step 6 of 7Reports
Filtered exports
Any report can be filtered by date range and job status, then printed, saved, or exported to CSV.
What to do
Set the filters at the top of the Reports page, then click Print, Save, or CSV in the top-right.
Why it matters
Boards, accountants, and lenders want clean reports. Pulling them out of Printcore takes a click.
Numbers make sense 📊
Next: shipping and fulfillment workflow.